

You can't be a PM or business owner without a deep understanding of machine learning: establishing the business value and then rallying a team to deliver to that value without falling into the many unique pitfalls of ML programs. Here is a "cheat sheet" compilation of how to deliver machine learning products and programs, highlighting practical tips from someone who's been on the journey. THE 4 PHASES OF MACHINE LEARNING PROGRAMS Machine Learnings programs - whether the creation of a new product or a new operational process - are delivered in 4 phases:
These phases are iterative. Teams are encouraged to jump back and forth and cycle between phases frequently. Here's a look at the popular CRISP-DM process championed by IBM. It has 6 boxes but essentially fits the 4 phases I mention. Note that it is iterative, as illustrated by the circular arrows. 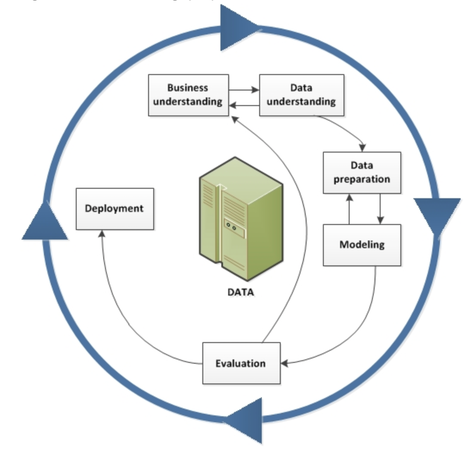 Microsoft has its own ML project flow called Team Data Science Process (TDSP). Though the diagram they published looks more complex, at its core it has the same basic 4 phases: understand the business, ready the data, develop a model, and deploy (seen in the the 4 big circles in the center of the diagram). 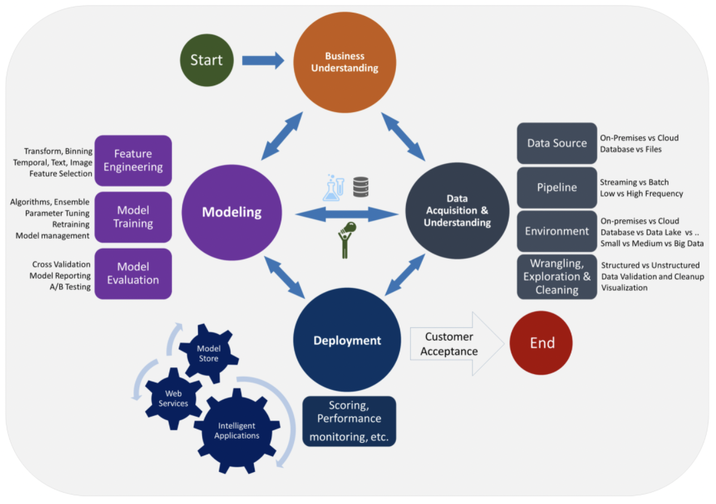 And finally here is the project lifecycle proposed by Andrew Ng from DeepLearning.ai, a popular thought leader and online instructor, showing yet again essentially the same 4 phases. 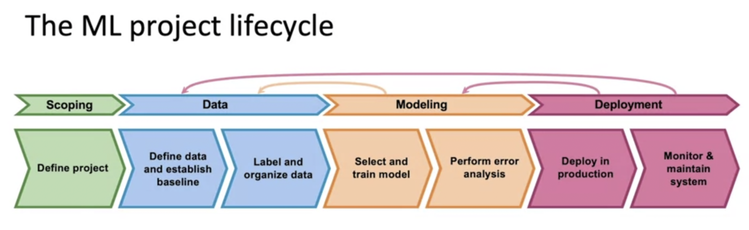 Let's go through the 4 main phases and highlight the key things PMs need to anticipate for each. 1. ESTABLISH THE BUSINESS CASE AND PROJECT PLAN Business Case Establishing the business case and business plan / product strategy is truly product management 101, yet with the hype of ML we often skip the rigor of answering some of these fundamental questions:
Startups are subject to a great deal of scrutiny on these questions their investors, but ironically it's established companied looking to launch an ML product that are more likely to gloss over the business case in their hurry to develop something related to "artificial intelligence". Don't let your org skip this fundamental step! The answers to these questions are not things you come up with in a board room with the team. They come from the outside, talking to customers and prospects directly via product-market fit interviews. Feasibility Next you validate feasibility, i.e. is this actually something that is likely solvable by ML? Feasibility is a sticky subject because there are still a lot of unsolved business problems out there that ML could have the potential to solve, so the PM and leadership need to strike the right balance of taking a risk vs. being confident that the solution is sufficiently within reach. Ask your team: do you even need an ML algorithm? Is what you're trying to accomplish something that could be done by traditional business logic instead? As Wytsma and Carquex argue in 5 Steps for Building Machine Learning Models for Business, a LOT of what business owners think they want from ML can be more efficiently solved by heuristics implemented with traditional business logic, as shown in the table below! The moral: don't do ML to say that you're doing ML, your business problem needs to be something that truly warrants ML. 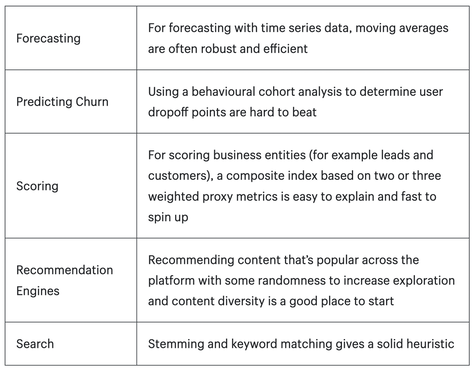 Problem Statement ML programs require a lot of very specific and precise objectives. If you are not super clear and aligned from customer to leadership to the team on what you are trying to achieve, ML programs more than traditional programs are likely to not deliver. Is the most important thing to save customers time, or encourage them to buy more? Are we optimizing for accuracy or speed? Managers who are used to saying "I want all of those things" and leave requirements open-ended will have a hard time, as discussed in Most Common Pitfalls of Delivering an AI Program. There will be major trade-offs and unexpected miscommunications if these decisions are not confronted head on. Write down a short problem statement that summarizes what you are trying to achieve. Make it visible and check in regularly. Everybody on the team should share the same understanding of the problem that you're solving Outcome Metrics and Output Metrics To support the business case and problem statement, you should include quantifiable outcome metrics. This could include more specific targets that you expect to achieve, such as ("Customers renew 20% more often because the new algorithm increased its relevance" or "Employees save 10% of time thanks to automation of a specific daily task"). Then the technical team must write corresponding output metrics, such as a quantifiable measure of the algorithm's relevance, accuracy, precision, throughput, etc. The PM is in the middle, responsible for making sure that if the technical team delivers output metrics, this will ensure that the business achieves its outcome metrics. To help focus the ML team and the ML algorithm itself, it's best to select 1 optimizing metric that the team should focus on improving as much as possible, and other satisficing metrics that simply need to meet a minimum threshold. For example, perhaps your optimizing metric is precision and you select satisficing metrics for recall, speed and throughput above a certain basic threshold. Ensure targets are reasonable by comparing them to benchmarks such as human-level performance, or competitor or open-source benchmarks, or research study benchmarks (taken in the right context). Otherwise you may have a manager insisting on 99.9% accuracy and you don't have grounds to explain why this is or isn't reasonable. Finally, remember that you FIRST set targets that will achieve the business plan, THEN worry about how to achieve them (same as in other disciplines like sales - first you set the sales target your business needs, then you figure out how to get there by doing things like hiring more, changing tactics, etc.). Don't undermine your business case upfront by setting too low a bar. Non-functional requirements Let's not forget that for every ML program, there's not just the algorithm but also all the software and hardware infrastructure around it! Work with the engineering team to develop your non-functional requirements: is the overall system in the cloud or on the edge, what is the system availability, resiliency posture and security needs? (for a fulsome list, see checklist of non-functional requirements). There are also some key non-functional requirements that must be defined for the algorithm itself, notably:
Project Plan and Scorecards Finally you develop the project plan, defining the scope of the project and the plan to deliver to the business plan. In Amazon's excellent paper Managing Machine Learning Projects, the author lives and dies by scorecards for all facets of the program - go-to-market, financial, data, etc. PMPs will recognize these scorecards as simply actionable risk registers, used to continuously anticipate and steer clear of pitfalls and prioritize mitigations. 2. GATHER AND PREPARE THE DATA Sourcing Data Once we have an initial pass through the business plan and project plan phases, it's time to source data. Data needs to be sourced in a way that is representative of the data your algorithm will encounter in production. It's worth getting leadership to look at samples of the data set to make sure you have buy-in that this is the right data. Even a slight change in approach (e.g. data from US vs. data from Canada, photos of cars taken from a street camera vs. photos of cars taken from a mobile phone) could totally change the algorithm. For supervised learning (the most common type of ML), the data you source has to be labelled, so that the model can learn how to map the features of the data to the labels. This forms the basis of the prediction or classification of future data. There are lots of different ways to source data, each with cost, time and quality trade-offs. The team should not get focused on just 1 source but instead start by brainstorming a wide list of possible sources and then deciding which sources to acquire first. Sources can depend on the amount of data you need, and whether that data is structured or unstructured:
Data Pipeline In ML engineering, we start to establish an ML Pipeline across data, the model, and the deployment and monitoring (rollout) phases. Here is Robert Crowley's representation of an ML pipeline's components. 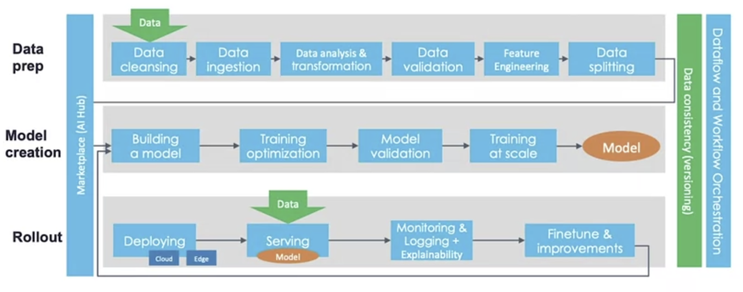 In essence, once we've sourced data from users, employees or 3rd parties, we build a data pipeline that processes the data in various stages, getting it ready for the model to be trained: The first row of the diagram is the data pipeline:
Read more: What Makes A Top 1% Project Manager? 3. DEVELOP THE MODEL There are 3 major types of ML algorithms: 1. Supervised Learning: find patterns within the labels of your data to make predictions. Ultimately it creates a mapping of all possible inputs x to predictions y.
2. Unsupervised Learning: the data is not labelled, so the algorithm finds patterns finding clusters (groupings) of points together that have similar features (e.g. K Means Cluster algorithm). Unsupervised learning is relatively harder, and sometimes the clusters obtained are difficult to understand because of the lack of labels or classes. Other unsupervised learning approaches include Apriori algorithm (generating IF_THEN rules such as IF people buy an iPad THEN they also buy an iPad Case to protect it), and Principal Component Analysis. 3. Reinforcement Learning: figure out a solution to a problem using rewards and punishments as reinforcements. The model is rewarded if it completes the job and punished when it fails. The tricky part is to figure out what kind of rewards and punishment would be suited for the model. These algorithms choose an action, based on each data point and later learn how good the decision was. Over time, the algorithm changes its strategy to learn better and achieve the best reward.  Hypothesis, Train, Error Analysis, Repeat Developing the model (aka algorithm) is a highly iterative process in and of itself. It should be a cycle where you continuously:
Don't Spend Too Much Time Although each step may sound complex to a PM or business owner, best practice is to spend about 2 days on each step. The ML team shouldn't get stuck in analysis paralysis or perfectionist thinking on any step beyond a few days. Just start by overfitting a small amount of data. Training Optimization What do I mean by overfitting? As you go through this iterative process and are conducting the error analysis step, 2 possibilities emerge:
Going through this process is called training optimization. Earlier I mentioned the importance of engineering features that are orthogonal. This way if you underfit or overfit the data, you can try modifying parameters that are relevant to one feature at a time, in isolation, to see if it can yield an improvement. Modeling in Academia vs. Modeling in Production A lot of data science talent will come from the academic world, and they will have to get used to priorities being different when building ML for production:
Metadata The process of modelling should use version control to help the team keep track of what has been tried already, what worked and what hasn't. This is critical when analyzing results compared to previous iterations and formulating your next hypothesis. Track metadata for data provenance and data lineage. Start in a spreadsheet for small project if you want, but as data scales you'll need a tool like TensorFlow to manage metadata across large amounts of data and many different iterations of the possible models. Model Evaluation When evaluating your model hypothesis, compare it to the specific output metrics you identified in Phase 1. For example, maybe your optimizing metric is the common F1 score, where F1 is a combination of:
When you feel that the model is sufficiently trained, then re-train the final model on all the data from scratch. Then perform model scoring on test set, evaluate using error metrics defined in project. Understand performance on certain slices of the data. When doing error analysis, tag the various errors (e.g. blurry image, small image) and see which tags come up most often, that will point you to where the biggest sources of errors to focus on might be. Balancing Accuracy with Performance and Cost Part of having an optimizing metric such as F1 and satisficing (or gating) metrics that ensure a threshold of latency and throughput means that there might be trade-off's in the model and the software/hardware infrastructure to support the model. For example, a super accurate model might have many high-order polynomial calculations that take a long time to compute. You could invest in a lot of high-performance hardware (servers, GPUs) and distributed architecture to compensate for this latency, but this comes at a high cost that may be out of reach if you're not Google or Facebook. Or you might sacrifice 1% of accuracy to meet latency and throughput thresholds. This is where data science meets engineering meets business thinking - all groups have to get creative together on the optimal path to handle the trade-offs. 4. DEPLOY AND MONITOR
Once the system is deployed, the job is only 50% done. The other 50% ahead is now the substantial effort required to monitor and maintain the system, which can be far more taxing than monitoring and maintaining traditional software. Progressive Roll-out To start, ML systems are typically not deployed broadly. Rather, start small and progressively roll-out to more users as you have success. Options include:
Along the way you measure whether you are achieving the business objectives (as measured by the outcome metrics you specified in Phase 1), using techniques like hindsight scenario testing, A/B testing, and user interviews about their qualitative experience during the pilot phase. Model Drift Models eventually lose their predictive power, called "model drift" or "model decay". This can be due to data drift and concept drift. Data drift is when the live data coming in to your model no longer has the expected distribution. For example, in an e-commerce store selling shoes, data drift may occur as the seasons change and customers' preferences for different types of shoes change. Concept drift is when the basic concepts your model has been trained to recognize start to be labelled differently altogether. For example, fashion changes and the shoes of today no longer look like shoes the model was trained to recognize a few years ago. Since both drifts involve a statistical change in the data, the best approach to detect them is by monitoring its statistical properties, the model’s predictions, and their correlation with other factors. Drifts can be slow or very sudden. Usually consumer changes are slow trends over time, whereas in a B2B context an entire enterprise can shift quite suddenly (if for example a company tells all of its workers to change their behaviour one day, or installs a new company-wide software). Monitoring the Right Metrics The selection of metrics to deploy is critical. Consider input metrics (input length, values, volume, # of missing values, avg image brightness), and output metrics (e.g. clickthrough rates, null value returns, number of times the user has to repeat their query or switch to manual typing). Set thresholds for alarms. Monitoring is very critical to check the health of the software and hardware of the system itself. Many problems can arise over time such as sensor malfunctions, system downtime, bandwidth issues, etc. Consider software metrics (memory, server load, throughput, latency) in addition to inputs and outputs. Deployment Is An Iterative Process Too Just as all other steps of the ML process described in this article are iterative, so too is deployment and maintenance. As metrics show that the model is no longer performing at an acceptable level, update the model and redeploy with refreshed thresholds so that monitoring is prepared to sound the alarms when the time comes again.
0 Comments
Your comment will be posted after it is approved.
Leave a Reply. |